World GDP Growth Over the Last Two Millennia
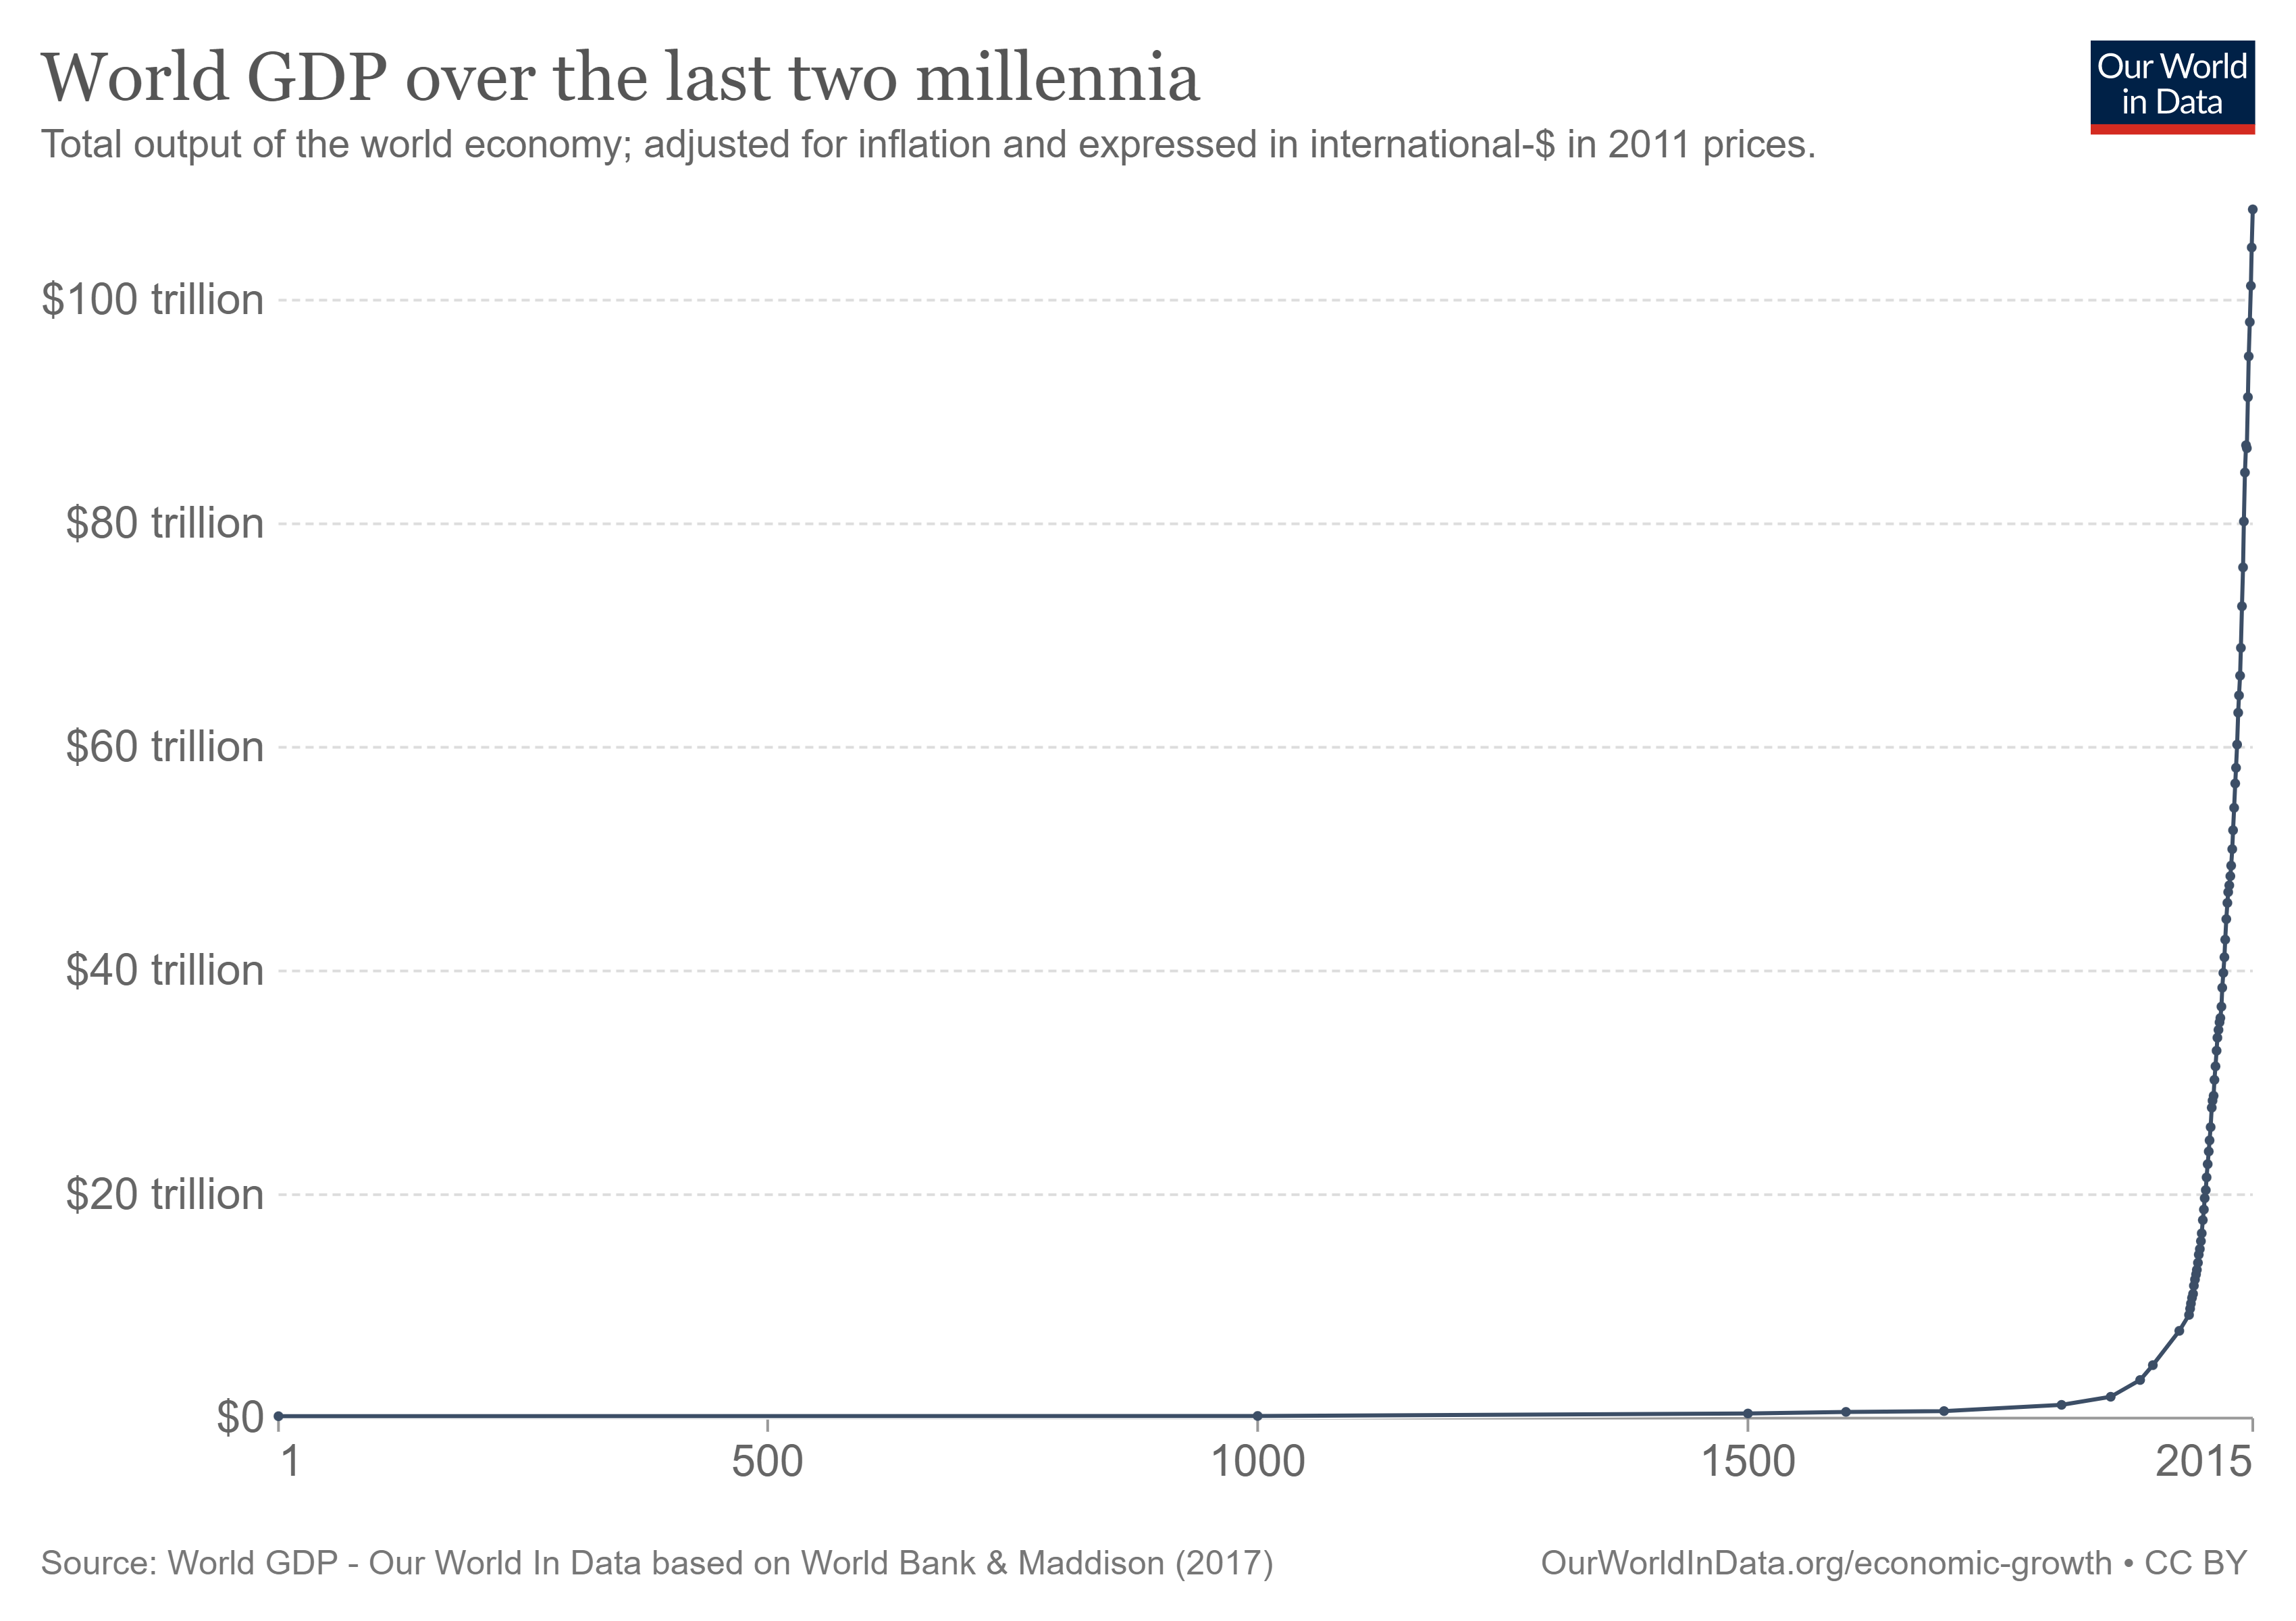
An interesting image of World GDP over the last 2 millennia. Taken over the long term, it is extraordinary to see the growth over the last 100 years.
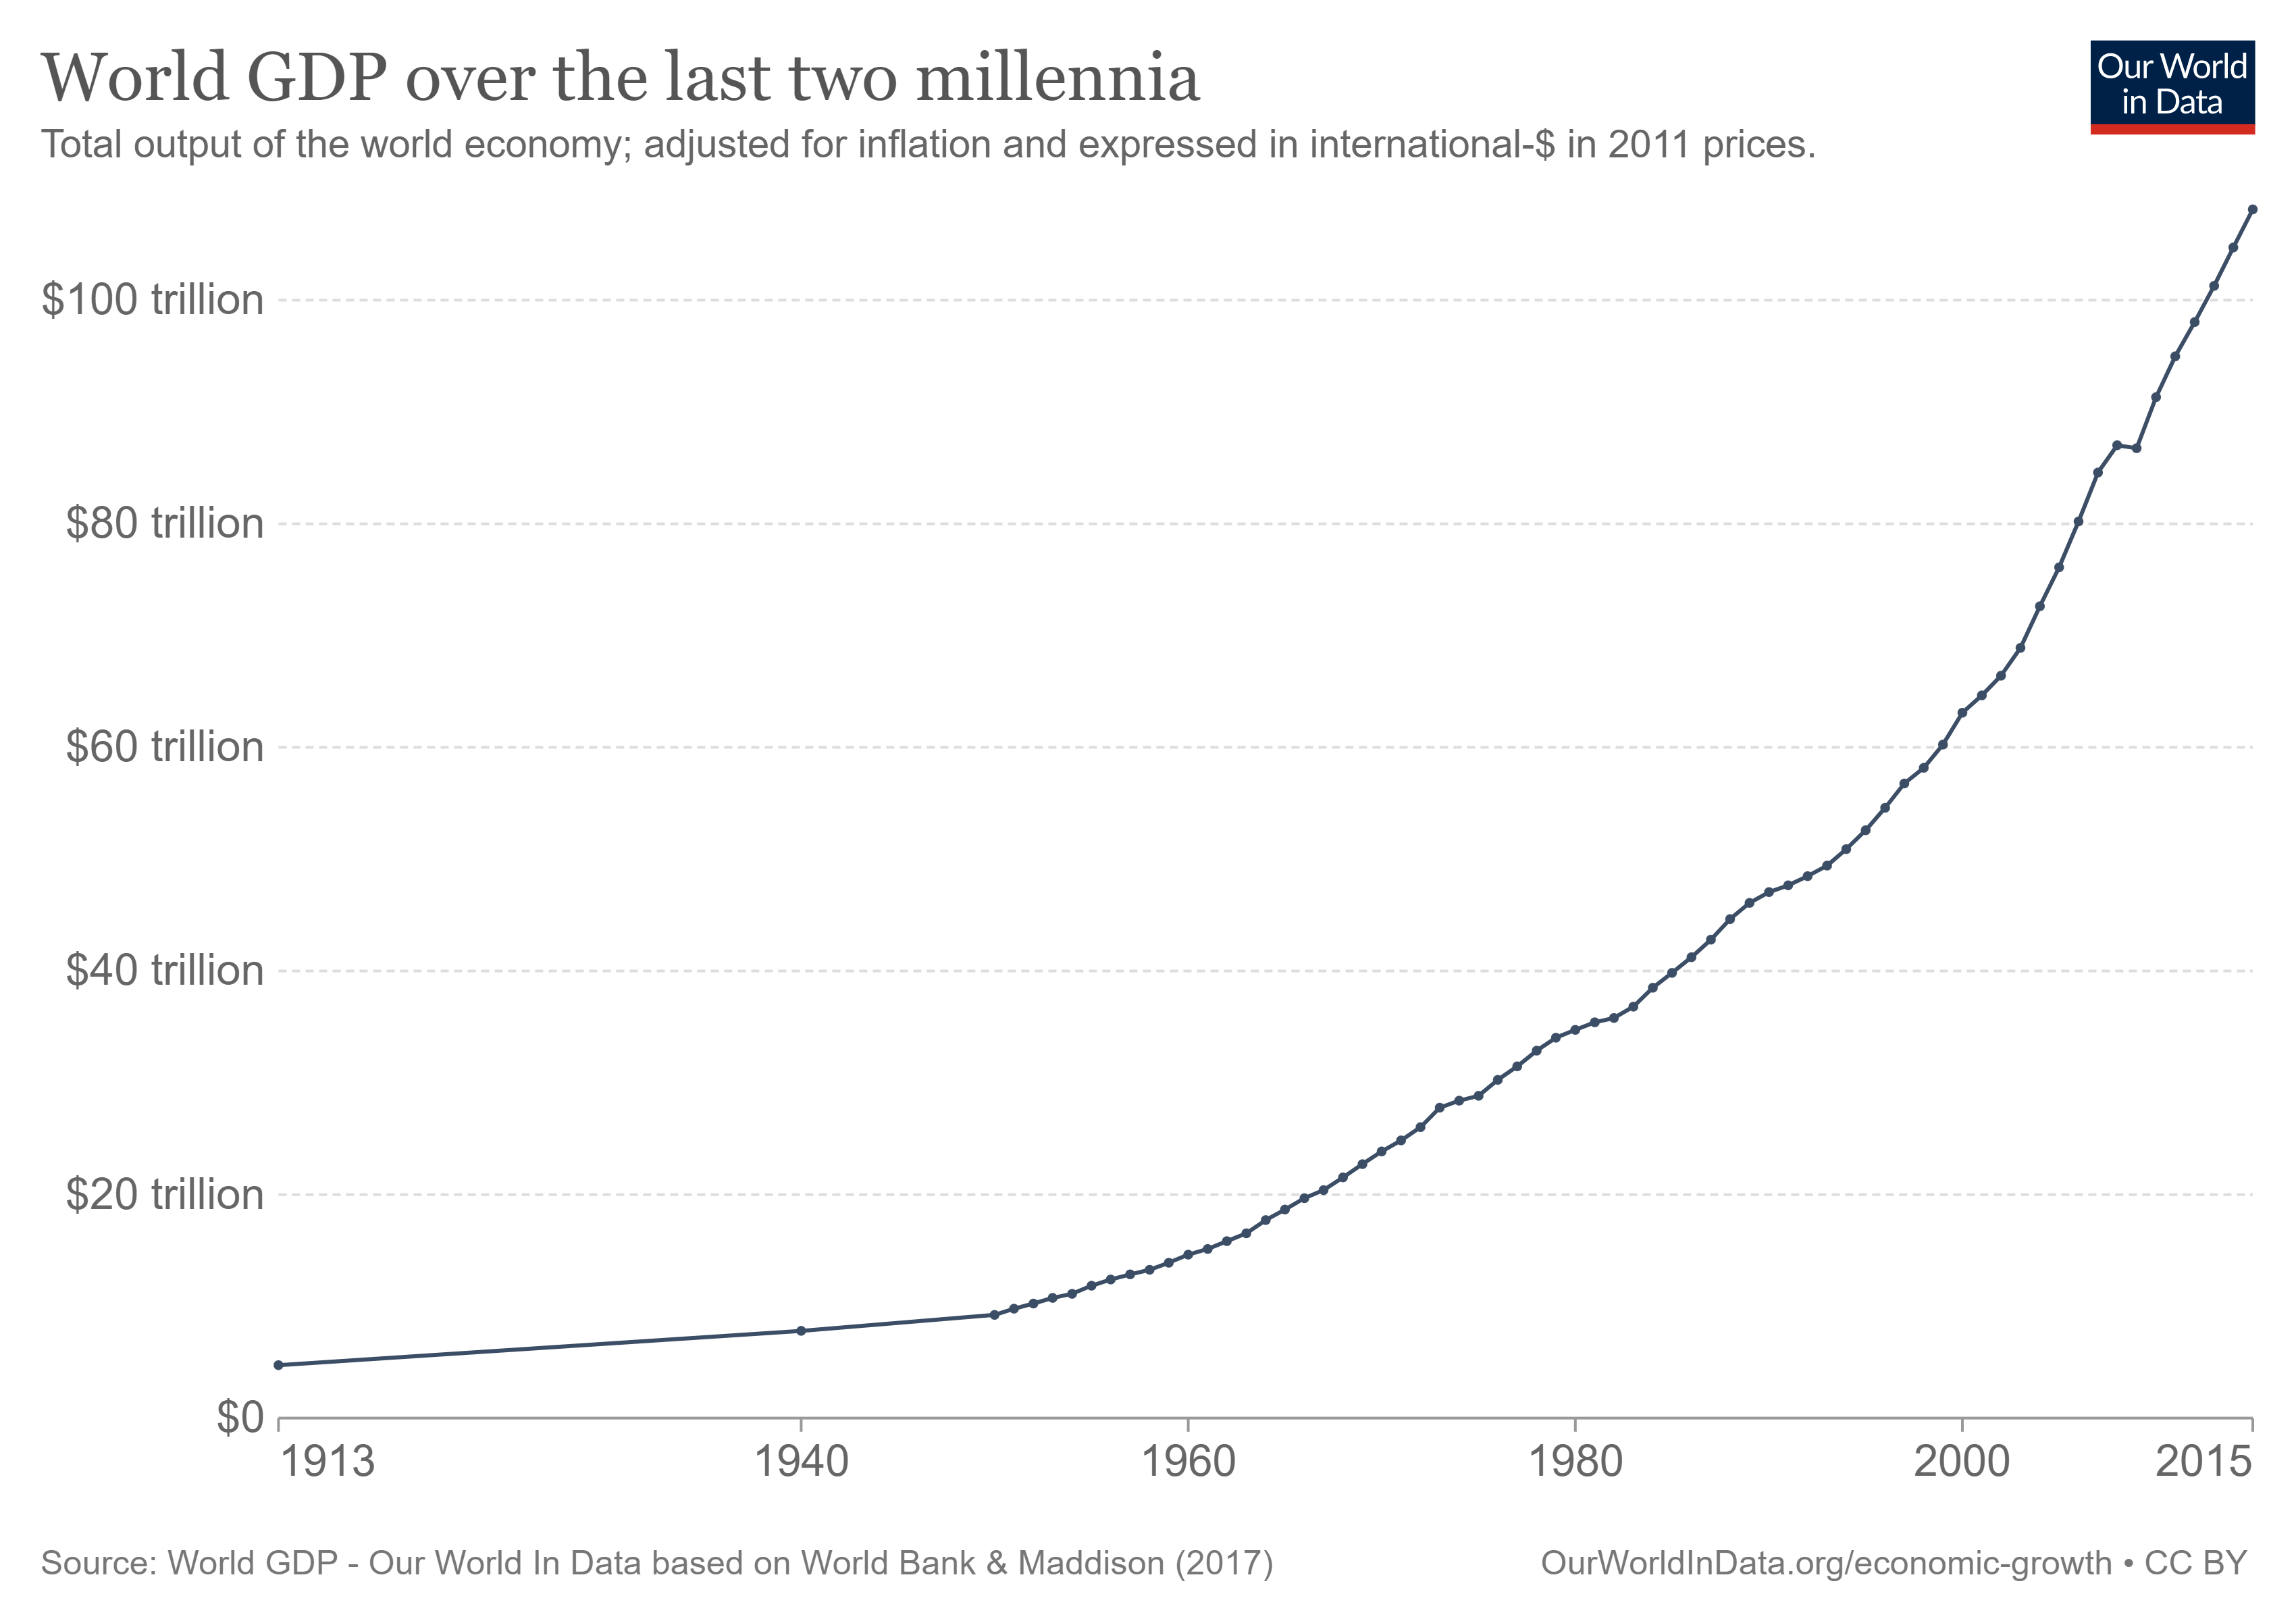
But even if you narrow the timeline down to the last 100 years, global GDP growth remains remarkable.
I find this picture interesting for a few reasons.
First, the compounding effect of technical advancement and innovation. The more we advance, the more we advance, the more we advance. This is the root of one of my fears for South Africa. If we fail to advance technologically at the same pace as the global leaders, we’ll fall behind incredibly quickly, and it will be very difficult to claw back. It is imperative that we (South African private enterprise and government) prioritise investment in innovation and technical advancement.
Second, it is no surprise that we sit with the environmental catastrophe that we do. This level of growth, unchecked by policy to protect the environment, will inevitably cause damage. I expect that the pace of environmental damage is likely to be correlated with the rate of GDP growth. We’ll crunch the numbers and feedback on this next week.
Third, how sustainable is it? I’ve seen some authors argue that it is not sustainable at all. I wonder if that is true. There are clear impediments to ongoing growth such as the capacity of our environment and slowing population growth. But will they really be barriers? Or will we find a way to continue growing? Mankind is great at solving problems. My money is on the latter!
World GDP Growth Over the Last Two Millennia

World GDP Growth Over the Last One Hundred Years

To view the interactive chart and source of the data, visit here.


